Last updated: July 7, 2026
Executive summary
The University of Washington retained Milliman to conduct a cash compensation study for its professional staff positions.
Milliman evaluated cash compensation for 58 benchmark jobs in the University’s professional staff group. Base salary and total cash compensation data were collected from regional and national institutions of higher education via a custom survey for 38 jobs and published surveys for 58 jobs.
The custom survey was distributed to 78 target institutions. Twenty-seven (27) institutions participated in the survey.
A similar survey was conducted by Milliman in 2007, 2012, 2015, 2017, 2019, and 2021.
In 2023, Milliman used many of the same published survey sources as 2021. Where published sources were the same as the previous study, Milliman used survey matches that were approved by the Professional Staff Salary Advisory Group (a committee of professional staff employees) and the University’s Compensation Office.
The 58 benchmark jobs, chosen by the University’s Compensation Office, the Professional Staff Salary Survey Advisory Group and Milliman, provide a solid representation of benchmark positions within the University’s grade structure and across job groups as summarized by the tables that follow.
Market conditions have changed since the period when the last survey was completed; minimum wage has shown more aggressive increases.
Historical Economic Factors
| 2017 | 2019 | 2021 | 2023 | |
|---|---|---|---|---|
| Unemployment (Washington) | 4.5% | 4.4% | 5.3% | 3.8% |
| Turnover (Puget Sound) | 18.3% | 20.2% | 17.3% | 22.1% |
| Minimum Wage (Washington) | $11.00 | $12.00 | $13.69 | $15.74 |
| Minimum Wage (Seattle)* | $15.00 | $16.00 | $16.69 | $18.69 |
* Large employer minimum wage.
Geographic differential
The “going rate” of pay for any particular job varies from place to place. However, the cost of living is only one of many economic factors, including: availability of / competition for skilled workers, health of the industry, desirability of the location, technological advances, increases in productivity, how much income the organization can bring in for their product or service. For example, in the energy industry, employers may need to offer less to attract workers to a job in a large city where the cost of living is higher (but the schools are good, spouses have opportunity for employment and the weather is pleasant) than they would need to pay to lure workers to a small, remote town. In the Pacific Northwest, you can see from the statistics that pay does not necessarily track with cost of living:*
- In Boise, average pay is 7.2% lower than the national average but cost of living has increased significantly to 14.3% higher than the U.S. overall
- In Portland average pay is 4.6% higher than the U.S. overall but cost of living is 23.2% higher
- Spokane may still be a good deal for workers―average pay there is 2.2% lower than the national average and cost of living is only 0.9% more.
These geographic differentials, due to economic variations, were applied to both the published data (national) and participants’ data from the Higher Education
Custom Survey that Milliman administered, to come to an “apples to apples” comparison. The differentials applied are from the Economic Research Institute
Geographic Assessor Report. For the University of Washington, Seattle is the base region and data from the other cities are adjusted relative to the base. For
instance, if the cost-of-labor average wage and income levels for another participant are 7.5% above Seattle, the numbers collected from that organization are decreased by 7.5% to be comparable to UW’s market.
* Differentials shown come from the Economic Research Institute (ERI), Geographic Assessor Report and are based on a $80,000 salary level.
Cost of Living vs. Cost of Labor
What exactly do these two terms mean?
“Cost of living” refers to the costs to a consumer in a specific geographic area. It reflects the price of food, housing, groceries, transportation, taxes and
entertainment. Simply put, it’s the cost of maintaining a certain standard of living.
“Cost of labor” refers to the employer’s cost for labor of salary or pay in a specific geographic area. Another way to phrase this is that the cost of labor is what a particular geographic market offers as the going rate of compensation for its jobs.
Findings
The chart below illustrates the changes in market compensation over the past 37 years and shows the University’s annual professional staff salary increase meritpool percentage for the most recent 30 years.
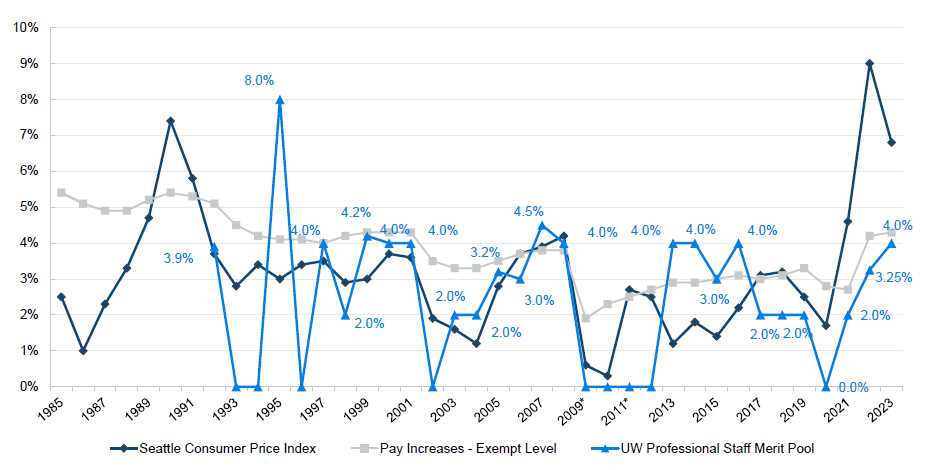
*State-imposed salary freeze February 2009 through 2012
Note: 2023 Data includes the University’s Estimate for 2023 as well as partial year Consumer Price Index
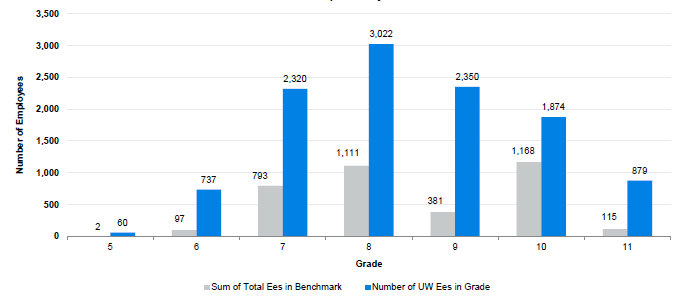
The 58 benchmark jobs, chosen by the UW Compensation Office, the Professional Staff Salary Survey Advisory Committee, and Milliman provide a solid representation of jobs and employees within the University’s grade structure and across job groups as summarized by the table below and on the following page.
Professional Staff Survey 2023
Breakdown of Population by Grades 5-11
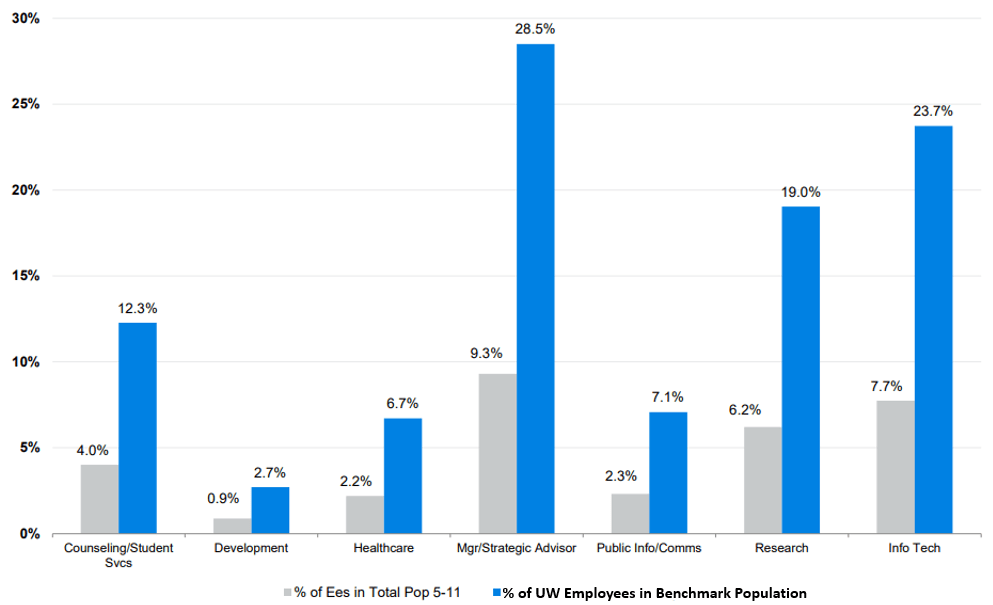
Professional Staff Survey 2023
Breakdown of Population by Benchmark Categories
(11,242 Ees in Grades 5-11, 3,667 Ees in Benchmark Jobs)
The University’s entire professional staff supports one of the nation’s premier public research universities. UW Medicine is a leading healthcare provider in the region and nationally known for a number of its programs. The staff in this group on all three of the University’s campuses provide expertise to support the University’s teaching, research and public service mission.
Maintaining competitive levels of compensation is critical to staff retention. Compensation for new hires is also critical in that the University must offer competitive rates consistent with what their peers are offering as well as what existing employees at the University are being paid.
This analysis covers professional staff jobs in grades 5 through 11, which includes 11,242 employees.
The number of professional staff in grades 5 through 11 has grown since 2021, particularly due to strong hiring in the information technology job family. However, there has been significant change in the mix of employees in the professional staff job families covered by this salary study. The Professional Staff Program only applies to non-represented employees. Since 2021, approximately 1,600 former professional staff are now represented by various unions and are no longer covered by the Professional Staff Program.
The former professional staff employees are in four pockets, each that moved into its own union-represented bargaining units. This included approximately 40 employees in KUOW radio that became represented by SAG-AFTRA, approximately 200 employees in the School of Medicine Institute for Health Metrics Evaluation (IHME), another approximately 40 employees in the UW libraries, and most recently, in 2023, approximately 1,400 employees in the Research/Scientist Engineer (RSE) series (in jobs RSE Assistant, RSE 1, RSE 2, RSE 3 and RSE 4). As a result of the RSE changes, three benchmarks in the research job family for job profiles in the RSE series are no longer in this study, and three new research benchmarks have been added: Research Manager (grade 9), Research Scientist/Engineer – Senior (grade 10), and Research Coordinator (grade 7). In addition to the new research benchmarks, three other new benchmarks have been added this year: Recruiter (grade 8), Donor Relations Officer (grade 8), and Student Counseling Psychologist (8).
The University sources professional staff employees from the education sector and from general industry (including the private sector). In instances of turnover, the University loses employees to both markets. The private sector can often provide a total pay package that includes elements that the University does not offer, and which makes competing difficult for most educational institutions. For example, the private sector can offer direct compensation that consists of base salary, annual incentives, benefits, and often long-term incentives such as stock options.
The University is limited in the value of its total compensation package by the absence of annual and/or long-term incentives. Historically the University has addressed this limitation by:
- Targeting total cash compensation (base plus incentives) for these jobs at the 50th percentile total cash level in the market. This practice provides the University with the ability to offer a stronger cash compensation package than many of its counterparts.
- Providing benefits that are above average in the market. Medical, dental, disability and retirement benefits have traditionally been, and continue to be, above the median and close to or above the 75th percentile when compared to Milliman’s database.
Additionally, when making a national hire the University is more challenged than many of its peer institutions because of its location. The cost of living in the greater Seattle area is roughly 53% higher than the national average, according to Economic Research Institute data. Cost of living certainly impacts the decisions of potential employees from other parts of the country. While the cost of labor in Seattle is 18.6% higher than the national average and new recruits can make more dollars here than in many locations, the difference can present obstacles to recruiting.
While the above elements can impact recruitment, the University provides a number of significant attractions beyond direct compensation. These include a highly desirable location, the opportunity to work at a premier institution of higher education, a stimulating work environment, job security, and rich cultural experiences, to name just a few.
This compensation analysis included a custom survey of institutions of higher education and data from published surveys. Published data used are primarily regional in nature while the custom survey included universities across the United States (global challenge peer institutions as well as the University’s primary peer group). All national data in this report, both published survey data and data from the custom survey, have been geographically adjusted to reflect the Puget Sound area.
Methods
Benchmark positions and compensation data sources
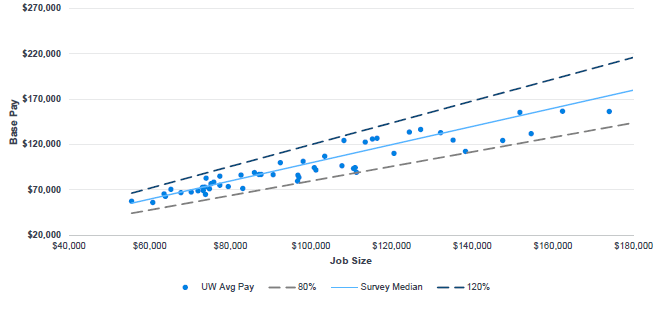
Cash compensation in general is well aligned with the market TCC 50th percentile. When comparing the University of Washington individual salaries to the market TCC 50th percentile, the University employee-weighted average has improved to 2.4% (from 9.9%) below the market including the Research job grouping, which has historically been an outlier. For this reason, we believe it is no longer necessary to calculate a separate weighted average excluding the Research job grouping.
Similar to the previous professional staff studies, the results suggest that the University has been able to provide reasonably competitive compensation around the market target. The chart below shows how the University’s base pay compares to a normal range around the market TCC 50th percentile (a normal range is usually considered between 80% and 120% of the market competitive level). As illustrated, all jobs fall within a “normal” range around the market 50th percentile.
Normal Market Range
The following table lists the benchmark positions and the survey data sources used for each job.
| Job Family | Benchmark | Survey Data Source Note: Hover over dot to view source |
||||||||||||||
|---|---|---|---|---|---|---|---|---|---|---|---|---|---|---|---|---|
| Counseling / Student Services | ||||||||||||||||
| C | Academic Counselor |
x
|
x
|
x
|
||||||||||||
| C | Academic Counselor – Lead |
x
|
||||||||||||||
| C | Counseling Services Coordinator |
x
|
x
|
|||||||||||||
| C | Education Outreach – Program Manager |
x
|
x
|
|||||||||||||
| C | Education Outreach Specialist (Entry) |
x
|
||||||||||||||
| C | Mental Health Therapist |
x
|
x
|
x
|
||||||||||||
| C | Student or Academic Services Director |
x
|
||||||||||||||
| C | Student Counseling Psychologist |
x
|
x
|
x
|
x
|
|||||||||||
| C | Student Services Advisor/Counselor |
x
|
x
|
x
|
||||||||||||
| C | Student Services Advisor/Counselor (Lead) |
x
|
x
|
|||||||||||||
| C | Student Services Advisor/Counselor (Senior) |
x
|
x
|
|||||||||||||
| Development | ||||||||||||||||
| D | Development Officer |
x
|
x
|
|||||||||||||
| D | Donor Relations Officer |
x
|
x
|
x
|
||||||||||||
| D | Major Gifts Officer |
x
|
x
|
x
|
x
|
x
|
||||||||||
| Health Care | ||||||||||||||||
| H | Clinical Nurse Specialist Educator |
x
|
x
|
|||||||||||||
| H | Clinic Manager |
x
|
||||||||||||||
| H | Financial Analyst/Decision Support |
x
|
x
|
|||||||||||||
| H | Nurse Manager |
x
|
x
|
|||||||||||||
| H | Pharmacy Manager |
x
|
x
|
|||||||||||||
| Manager/Strategic Advisor | ||||||||||||||||
| M | Administrative Assistant |
x
|
x
|
|||||||||||||
| M | Administrator (Large Organization) |
x
|
||||||||||||||
| M | Administrator (Small Organization) |
x
|
||||||||||||||
| M | Auditor |
x
|
x
|
x
|
||||||||||||
| M | Budget Analyst |
x
|
x
|
x
|
x
|
|||||||||||
| M | Compliance Analyst |
x
|
||||||||||||||
| M | Construction Project Manager |
x
|
x
|
x
|
||||||||||||
| M | Executive Assistant |
x
|
x
|
x
|
||||||||||||
| M | Food Service Assistant Manager |
x
|
x
|
|||||||||||||
| M | Food Service Manager |
x
|
x
|
|||||||||||||
| M | Grants and Contracts Program Manager/Specialist |
x
|
x
|
|||||||||||||
| M | Human Resources Consultant – Employee Relations |
x
|
x
|
x
|
||||||||||||
| M | Program Director/Manager (Large Program) |
x
|
||||||||||||||
| M | Program Director/Manager (Small Program) |
x
|
||||||||||||||
| M | Recruiter |
x
|
x
|
x
|
||||||||||||
| Public Information/Communications | ||||||||||||||||
| P | Graphic Designer |
x
|
x
|
x
|
x
|
|||||||||||
| P | Public Information Specialist (Entry Level) |
x
|
||||||||||||||
| P | Public Information Specialist (Journey Level) |
x
|
x
|
x
|
||||||||||||
| P | Public Information Specialist (Senior Level) |
x
|
x
|
x
|
||||||||||||
| P | Publications Coordinator |
x
|
||||||||||||||
| P | Web Content Specialist |
x
|
x
|
x
|
||||||||||||
| Research | ||||||||||||||||
| R | Principal Research Scientist/Research Engineer |
x
|
x
|
x
|
x
|
x
|
||||||||||
| R | Research Consultant |
x
|
||||||||||||||
| R | Research Coordinator (7) |
x
|
||||||||||||||
| R | Research Coordinator (8) |
x
|
||||||||||||||
| R | Research Manager |
x
|
x
|
x
|
x
|
x
|
||||||||||
| R | Research Scientist/Research Engineer – Senior |
x
|
x
|
x
|
x
|
x
|
||||||||||
| Information Technology | ||||||||||||||||
| T | Business System Analyst |
x
|
x
|
x
|
||||||||||||
| T | Department IT Manager |
x
|
x
|
|||||||||||||
| T | Director, IT (Large Organization) |
x
|
x
|
x
|
||||||||||||
| T | Network Engineer |
x
|
x
|
x
|
x
|
|||||||||||
| T | Principal Technology Program Manager – Enterprise-Wide Systems |
x
|
x
|
x
|
||||||||||||
| T | Senior Applications Systems Engineer – Enterprise-Wide Systems |
x
|
x
|
x
|
||||||||||||
| T | Senior Computer Specialist |
x
|
x
|
x
|
x
|
|||||||||||
| T | Software Engineer |
x
|
x
|
x
|
||||||||||||
| T | Systems Programmer |
x
|
x
|
x
|
x
|
|||||||||||
| T | Technology Program Manager – Enterprise-Wide Systems |
x
|
||||||||||||||
| T | Technology Project Manager |
x
|
x
|
x
|
||||||||||||
| T | Web Computing Specialist |
x
|
x
|
x
|
x
|
x
|
||||||||||
Custom survey invitees included peer universities and a group of regional higher education institutions (78 total). The following tables show organizations contacted and those submitting data for the 2017, 2019, 2021, and 2023 survey. Each year of the custom survey approximately 1/3 of the invited institutions participate.
| Peer Institutions | 2017 Participant | 2019 Participant | 2021 Participant | 2023 Participant |
|---|---|---|---|---|
| Baylor University | ||||
| Boise State University |
2019
|
2021
|
||
| Colorado State University | ||||
| Cornell University |
2017
|
2019
|
2021
|
2023
|
| Duke University |
2021
|
2023
|
||
| Florida State University | ||||
| Georgetown University |
2019
|
2021
|
2023
|
|
| Georgia Institute of Technology |
2017
|
2021
|
2023
|
|
| Indiana University |
2021
|
2023
|
||
| Iowa State University |
2017
|
2019
|
2021
|
2023
|
| Johns Hopkins University | ||||
| Michigan State University | ||||
| Montana State University | ||||
| New York University |
2021
|
|||
| North Carolina State University | ||||
| Ohio State University |
2017
|
2019
|
2021
|
2023
|
| Oregon Health Sciences University |
2017
|
2019
|
2023
|
|
| Oregon State University |
2023
|
|||
| Penn State |
2023
|
|||
| Rutgers University |
2017
|
2019
|
||
| Stanford University | ||||
| Syracuse University |
2017
|
2019
|
2021
|
2023
|
| Temple University | ||||
| Texas A&M University |
2017
|
2019
|
2021
|
2023
|
| University of Alabama | ||||
| University of Arizona |
2021
|
2023
|
||
| University of California – Berkeley | ||||
| University of California – Davis | ||||
| University of California – Irvine |
2017
|
|||
| University of California – Los Angeles | ||||
| University of California – San Diego | ||||
| University of California – San Francisco | ||||
| University of Chicago |
2023
|
|||
| University of Cincinnati |
2021
|
|||
| University of Colorado |
2019
|
|||
| University of Connecticut | ||||
| University of Dayton |
2017
|
|||
| University of Florida | ||||
| University of Georgia | ||||
| University of Hawaii at Manoa |
2017
|
|||
| University of Illinois – Chicago | ||||
| University of Iowa |
2017
|
2019
|
2021
|
2023
|
| University of Kansas |
2017
|
2019
|
2021
|
2023
|
| University of Kentucky |
2017
|
|||
| University of Maryland | ||||
| University of Massachusetts | ||||
| University of Michigan – Ann Arbor |
2019
|
2021
|
2023
|
|
| University of Minnesota Twin Cities |
2017
|
2019
|
2021
|
2023
|
| University of Missouri – Columbia | ||||
| University of Montana |
2017
|
|||
| University of New Mexico – Albuquerque |
2017
|
2019
|
||
| University of North Carolina – Chapel Hill |
2021
|
|||
| University of Notre Dame |
2017
|
2021
|
||
| University of Oregon | ||||
| University of Pennsylvania |
2017
|
2019
|
2021
|
2023
|
| University of Pittsburgh |
2019
|
2021
|
2023
|
|
| University of Rochester |
2023
|
|||
| University of Texas – Austin |
2017
|
2019
|
2021
|
2023
|
| University of Utah |
2017
|
|||
| University of Virginia | ||||
| University of Wisconsin at Madison | ||||
| Virginia Polytechnic Institute |
2017
|
2019
|
||
| West Virginia University |
2017
|
|||
| Yale University |
2017
|
| Regional Peer Institutions | 2017 Participant | 2019 Participant | 2021 Participant | 2023 Participant |
|---|---|---|---|---|
| Bellevue Community College |
2023
|
|||
| Cascadia Community College |
2021
|
|||
| Edmonds Community College | ||||
| Everett Community College |
2023
|
|||
| Green River Community College | ||||
| Highline Community College |
2021
|
|||
| Pierce College | ||||
| Seattle Colleges |
2021
|
|||
| Seattle University |
2019
|
2023
|
||
| Shoreline Community College |
2017
|
|||
| South Puget Sound Community College | ||||
| Tacoma Community College | ||||
| Washington State University |
2019
|
2023
|
||
| Western Washington University |
2017
|
2021
|
Published survey sources included both regional and national surveys. The list of surveys used in these analyses follows:
| National Surveys | Regional Surveys |
|---|---|
| UW Higher Education Custom Survey | Milliman Northwest Benefits Survey |
| CompAnalyst | Milliman Northwest Engineering / Scientific / Project Management Survey |
| Culpepper | Milliman Northwest Healthcare |
| CUPA HR Professionals in Higher Education Survey | Milliman Northwest Management and Professional |
| D.G. McDermott Associates, Institutional Advancement and Alumni Relations* | Milliman Northwest Technology |
| Economic Research Institute – Salary Assessor | Milliman Puget Sound Area Compensation |
| Payfactors | |
| Pearl Meyer Research and Development | |
| Radford | |
| Wamser University Foundation / Development |
*Previously conducted by McConnell & Associates.
Data reporting and analyses
Data gathered from all surveys were aged to July 1, 2023 using a 4% per year aging factor.
Job descriptions were provided to custom survey participants to assist them with job matching. Milliman followed up with each participant to clarify job matches
and input where necessary.
Milliman consultants began with the University reviewed job matches from 2021 and verified that they continued to be a good match in 2023.
Data provided in this report for all survey matches, where such data were available, (additional detailed data on market percentiles are included in the appendix) include base salary 50th and total cash compensation 50th.
Milliman compared the University’s benchmark average data to the market median total cash compensation (50th percentile). Other comparisons can be made using this data, but Milliman believes the 50th percentile (median) is the strongest point of comparison because:
- The 50th percentile is statistically more stable
- Outliers have less impact on this data point
- Participant changes have less impact on this data point
- Without a variable pay plan, the University should consider cash compensation offered in their labor market by targeting market total cash.
Using median total cash compensation (50th percentile) presents somewhat of a problem for the University. Some of the key surveys relied on for this study, such as CUPA, do not report total cash data. Considering this, for the purposes of this study, the University requested Milliman make the working assumption for survey sources not reporting median total cash that median base be equal to median total cash.
Explanation of data terms and tables
Job Family
The group to which the benchmark is connected for purposes of evaluating competitive pay within a group of benchmarks.
UW Job Code(s)
The unique number assigned to a job at the University. More than one job code may track to a benchmark.
UW Job Title
Current University of Washington job title which may be different from the survey title.
# UW Employees
Current count of employees assigned to the job title/code.
UW Average Annual Pay
The average annualized base salary of incumbents in the job as of July 2023.
Market 50th Base
Median (50th percentile) of actual pay for the job in the market data sources.
Market 50th TCC
Actual total cash compensation paid for the job in the market data sources.
UW/Market 50th TCC
The ratio of average pay for the job at the University of Washington compared to the market target.
UW Salary Grade
Current pay grade assigned to job.
Survey Code
The job code assigned to each benchmark job.
Survey Job Title
The title of the similar job in the survey source (note: jobs were matched not based on title but on job responsibilities, etc.).
Scope
The size or nature of the organizations included in the data from each survey source.
Base 25th
The market salary level at which 25% of organizations pay below.
Base 50th
The market salary level where half of organizations pay above and half below.
Weighted Average
The average base salary or market differential based on the total number of incumbents.
Base 75th
The market salary level where 25% of organizations pay above.
TCC
Total cash compensation (listed at the same market levels as above).
Market Target
The University of Washington’s identified competitive level of pay for the job (market 50th total cash compensation).
Survey findings
The University is generally competitive with the market, lagging by approximately 2.4% overall (weighted average) however, the level of competitiveness varies by job grouping and grade.
- The following table shows how each job grouping has compared to the market (UW Average Annual Pay versus TCC 50th) in 2023 and over the last four studies.
- The Research job group has been consistently lagging the market by 15% or more since 2012. The removal of 3 research benchmarks and addition of 3 new research benchmarks has improved competitive positioning. The new benchmarks in this group have a significant employee population and represent the job grouping well.
- The Healthcare job family fell below market for the first time since 2012 in 2021, but at -4.9% was still considered competitive compared to market practice and has since improved to be almost precisely “at market” (-0.04% behind market, which rounds to 0.0% ahead/behind market).
| Job Family | 2015 | 2017 | 2019 | 2021 | 2023 |
|---|---|---|---|---|---|
| Counseling/Student Services | -5.0% | -5.6% | -2.0% | -8.0% | -4.6% |
| Development | -15.6% | -13.5% | -11.4% | -15.8% | -2.8% |
| Healthcare | 11.3% | 10.9% | 4.4% | -4.9% | 0.0% |
| Manager/Strategic Advisor | -0.9% | 1.4% | -3.0% | -3.5% | -0.8% |
| Public Information/Communications | -10.8% | -5.0% | -7.5% | -11.5% | -8.8% |
| Research | -17.1% | -17.2% | -21.6% | -22.5% | -1.4% |
| Information Technology | -5.3% | -4.4% | -5.3% | -3.9% | -2.7% |
Competitive analysis by salary grade
The following tables provide comparison by grades for benchmark positions.
| Job Family | UW Job Code | UW Job Title | UW Salary Grade | # UW Ees | UW/Mkt 50th TCC |
|---|---|---|---|---|---|
| T | 11745, 21828 | Director, IT (Large Organization) | 11 | 21 | -11.5% |
| R | 11497, 23371 | Principal Research Scientist/Research Engineer | 11 | 77 | -10.0% |
| T | 11741, 21850 | Principal Technology Program Manager – Enterprise-Wide Systems | 11 | 17 | 2.5% |
| Total Incumbents and Weighted Average: | 115 | -8.5% | |||
| Job Family | UW Job Code | UW Job Title | UW Salary Grade | # UW Ees | UW/Mkt 50th TCC |
| M | 11250, 11300, 11500, 19117, 19257, 19118 | Administrator (Large Organization) | 10 | 95 | 9.6% |
| H | 11590, 21765 | Clinic Manager | 10 | 85 | 0.9% |
| H | 11200, 21750 | Clinical Nurse Specialist Educator | 10 | 65 | 7.6% |
| M | 11070, 19173 | Construction Project Manager | 10 | 25 | 7.7% |
| T | 11735, 21773 | Department IT Manager | 10 | 41 | -14.5% |
| D | 11554, 19252 | Major Gifts Officer | 10 | 42 | -8.4% |
| T | 11564, 21776 | Network Engineer | 10 | 27 | 15.2% |
| H | 11580, 21777 | Nurse Manager | 10 | 55 | -3.4% |
| H | 11591, 23322 | Pharmacy Manager | 10 | 12 | 4.3% |
| M | 11110, 11130, 11150, 11510, 19199, 19134, 19154, 19261 | Program Director/Manager (Large Program) | 10 | 303 | 8.3% |
| R | 11496, 21796 | Research Scientist/Research Engineer – Senior | 10 | 198 | -15.6% |
| T | 11730, 21797 | Senior Applications Systems Engineer – Enterprise-Wide Systems | 10 | 78 | -7.6% |
| T | 11490, 11560, 21801, 21800 | Software Engineer | 10 | 101 | 9.2% |
| T | 11680, 21807 | Technology Project Manager | 10 | 41 | -3.5% |
| Total Incumbents and Weighted Average: | 1,168 | 0.5% | |||
| Job Family | UW Job Code | UW Job Title | UW Salary Grade | # UW Ees | UW/Mkt 50th TCC |
| M | 11532, 19127 | Budget Analyst | 9 | 8 | -10.2% |
| T | 11681, 19163 | Business Systems Analyst | 9 | 67 | 3.7% |
| M | 11799, 19168 | Compliance Analyst | 9 | 58 | 3.9% |
| D | 11629, 19191 | Development Officer | 9 | 11 | -9.0% |
| C | 11209, 19179 | Education Outreach – Program Manager | 9 | 9 | -0.5% |
| H | 11184, 19274 | Financial Analyst/Decision Support | 9 | 29 | -15.1% |
| M | 11089, 19233 | Human Resources Consultant – Employee Relations | 9 | xx | % |
| R | 11769, 19306 | Research Manager | 9 | 46 | -18.6% |
| C | 11361, 19111 | Student or Academic Services Director | 9 | 67 | -14.6% |
| T | 11572, 19319 | Systems Programmer | 9 | 35 | -2.9% |
| T | 11739, 21806 | Technology Program Manager – Enterprise-Wide Systems | 9 | 6 | 10.4% |
| T | 11743, 19324 | Web Computing Specialist | 9 | 25 | 4.6% |
| Total Incumbents and Weighted Average: | 381 | -4.8% | |||
| Job Family | UW Job Code | UW Job Title | UW Salary Grade | # UW Ees | UW/Mkt 50th TCC |
| C | 11349, 11350, 19101, 19103 | Academic Counselor (Lead) | 8 | 27 | 2.5% |
| M | 11248, 11298, 11503, 19115, 19255, 19120 | Administrator (Small Organization) | 8 | 53 | 0.1% |
| M | 11556, 19160 | Auditor | 8 | 10 | 8.4% |
| D | 11635, 19194 | Donor Relations Officer | 8 | 46 | 3.8% |
| M | 11508, 19259 | Food Service Manager | 8 | 11 | -17.4% |
| M | 11775, 19211 | Grants and Contracts Program Manager/Specialist | 8 | 40 | -4.1% |
| C | 11308, 19264 | Mental Health Therapist | 8 | 19 | 10.3% |
| M | 11108, 11128, 11148, 11508, 11528, 19197, 19132, 19152, 19259, 19135 | Program Director/Manager (Small Program) | 8 | 157 | -10.6% |
| P | 11538, 19738 | Public Information Specialist (Senior Level) | 8 | 122 | -13.4% |
| M | 11078, 19240 | Recruiter | 8 | 30 | 4.8% |
| R | 11758, 19302 | Research Coordinator | 8 | 153 | 12.4% |
| T | 11568, 19310 | Senior Computer Specialist | 8 | 411 | -6.0% |
| C | 11281, 19286 | Student Counseling Psychologist | 8 | 13 | -19.5% |
| C | 11343, 19184 | Student Services Advisor/Counselor (Lead) | 8 | 19 | -2.6% |
| Total Incumbents and Weighted Average: | 1,111 | -3.5% | |||
| Job Family | UW Job Code | UW Job Title | UW Salary Grade | # UW Ees | UW/Mkt 50th TCC |
| C | 11377, 19617 | Counseling Services Coordinator | 7 | 201 | -3.9% |
| C | 11207, 11967, 19837 | Education Outreach Specialist (Entry) | 7 | 15 | -3.5% |
| M | 11157, 11257, 11314, 11337, 11387, 11944,19557, 19587, 19553, 11177, 19517, 19807, 19817, 11927, 19513, 19627 | Executive Assistant | 7 | 205 | -13.5% |
| P | 11697, 19214 | Graphic Designer | 7 | 29 | -5.2% |
| P | 11537, 19737 | Public Information Specialist (Journey Level) | 7 | 74 | -4.6% |
| P | 11672, 19777 | Publications Coordinator | 7 | 8 | -0.5% |
| R | 11757, 19787 | Research Coordinator | 7 | 217 | 8.5% |
| C | 11342, 19597 | Student Services Advisor/Counselor (Senior) | 7 | 20 | -0.8% |
| P | 11687, 19687 | Web Content Specialist | 7 | 24 | -7.0% |
| Total Incumbents and Weighted Average: | 793 | -3.1% | |||
| Job Family | UW Job Code | UW Job Title | UW Salary Grade | # UW Ees | UW/Mkt 50th TCC |
| C | 11347, 19100 | Academic Counselor | 6 | 39 | -1.3% |
| M | 19806, 11176, 11926, 19514, 11315, 19552, 19556, 11386, 19586, 19626, 11336 | Administrative Assistant | 6 | 17 | 3.7% |
| M | 11506, 19258 | Food Service Assistant Manager | 6 | 13 | -11.7% |
| R | 19696 | Research Consultant | 6 | 7 | -0.1% |
| C | 11341, 19596 | Student Services Advisor/Counselor | 6 | 21 | -7.1% |
| Total Incumbents and Weighted Average: | 97 | -3.0% | |||
| Job Family | UW Job Code | UW Job Title | UW Salary Grade | # UW Ees | UW/Mkt 50th TCC |
| P | 19735 | Student Services Advisor/Counselor | 5 | 2 | 4.1% |
| Total Incumbents and Weighted Average: | 2 | 4.1% | |||
The following table shows how each grade has compared to the market (UW Average Annual Pay versus TCC 50th) in 2023 and over the last five studies.
The most significant and consistent market lag has been in grades five and seven, but the removal of the Research benchmarks has improved the competitiveness of these grades.
Grade eleven continues to lag the market as it has over the last five years, however grade eleven is not the main focus on this study and is only represented by three benchmarks.
| Grades | 2015 | 2017 | 2019 | 2021 | 2023 |
|---|---|---|---|---|---|
| 11 | -9.9% | -4.1% | -14.6% | -14.2% | -8.5% |
| 10 | 5.1% | 9.3% | 3.2% | 0.0% | -4.8% |
| 9 | -9.7% | -8.8% | -11.5% | -18.0% | -4.8% |
| 8 | -4.6% | -4.1% | -5.2% | -4.0% | -3.5% |
| 7 | -16.3% | -17.3% | -17.2% | -18.5% | -3.1% |
| 6 | -15.4% | -12.1% | -2.9% | -3.9% | -3.0% |
| 5 | -13.9% | -19.5% | -22.1% | -25.2% | 4.1% |
UW benchmark job descriptions
- Academic Counselor
- Academic Counselor – Lead
- Counseling Services Coordinator
- Education Outreach – Program Manager
- Education Outreach Specialist (Entry)
- Mental Health Therapist
- Student Counseling Psychologist
- Student or Academic Services Director
- Student Services Advisor/Counselor
- Student Services Advisor/Counselor (Lead)
- Student Services Advisor/Counselor (Senior)
- Development Officer
- Donor Relations Officer
- Major Gifts Officer
- Clinical Nurse Specialist Educator
- Clinic Manager
- Financial Analyst/Decision Support
- Nurse Manager
- Pharmacy Manager
- Administrative Assistant
- Administrator (Large Organization)
- Administrator (Small Organization)
- Auditor
- Budget Analyst
- Compliance Analyst
- Construction Project Manager
- Executive Assistant
- Food Service Assistant Manager
- Food Service Manager
- Grants And Contracts Program Manager/Specialist
- Human Resources Consultant – Employee Relations
- Program Director/Manager (Large Program)
- Program Director/Manager (Small Program)
- Recruiter
- Graphic Designer
- Public Information Specialist (Entry Level)
- Public Information Specialist (Journey Level)
- Public Information Specialist (Senior Level)
- Publications Coordinator
- Web Content Specialist
- Principal Research Scientist/Research Engineer
- Research Consultant
- Research Coordinator (7)
- Research Coordinator (8)
- Research Manager
- Research Scientist/Research Engineer – Senior
- Business System Analyst
- Department IT Manager
- Director, IT (Large Organization)
- Network Engineer
- Principal Technology Program Manager – Enterprise-Wide Systems
- Senior Applications System Engineer – Enterprise-Wide Systems
- Senior Computer Specialist
- Software Engineer
- Systems Programmer
- Technology Program Manager – Enterprise-Wide Systems
- Technology Project Manager
- Web Computing Specialist