2019 Professional Staff Salary Survey
Executive summary
Background
The University of Washington retained Milliman to conduct a cash compensation study for its professional staff positions.
Milliman evaluated cash compensation for 56 benchmark jobs in the University’s professional staff group. Base salary and total cash compensation data were collected from regional and national institutions of higher education via a custom survey for 38 jobs and published surveys for 42 jobs.
The custom survey was distributed to 77 target institutions. Twenty-one institutions participated in the survey.
A similar survey was conducted by Milliman in 2007, 2012, 2015 and 2017.
In 2019, Milliman used many of the same published survey sources as 2017. Where published sources were the same as the previous study, Milliman used survey matches that were approved by the Professional Staff Salary Advisory Group (a committee of professional staff employees) and the University’s Compensation Office.
The 56 benchmark jobs, chosen by the University’s Compensation Office, the Professional Staff Salary Survey Advisory Group and Milliman, provide a solid representation of benchmark positions within the University’s grade structure and across job groups as summarized by the tables that follow.
Findings
Market conditions have changed since the period when the last survey was completed; minimum wage has shown more aggressive increases.
Historical Economic Factors
| 2012 | 2015 | 2017 | 2019 | |
|---|---|---|---|---|
| Unemployment (Washington) | 8.6% | 5.9% | 4.5% | 4.4% |
| Turnover (Puget Sound) | 15.8% | 17.6% | 18.3% | 20.2% |
| Minimum Wage (Washington) | $9.04 | $9.47 | $11.00 | $12.00 |
| Minimum Wage (Seattle)* | $9.04 | $11.00 | $15.00 | $16.00 |
* Large employer minimum wage.
The chart below illustrates the changes in market compensation over the past 34 years and also shows the University’s annual professional staff salary increase merit pool percentage for the most recent 27 years.
Market Compensation, Pay Increases, and Merit Pool
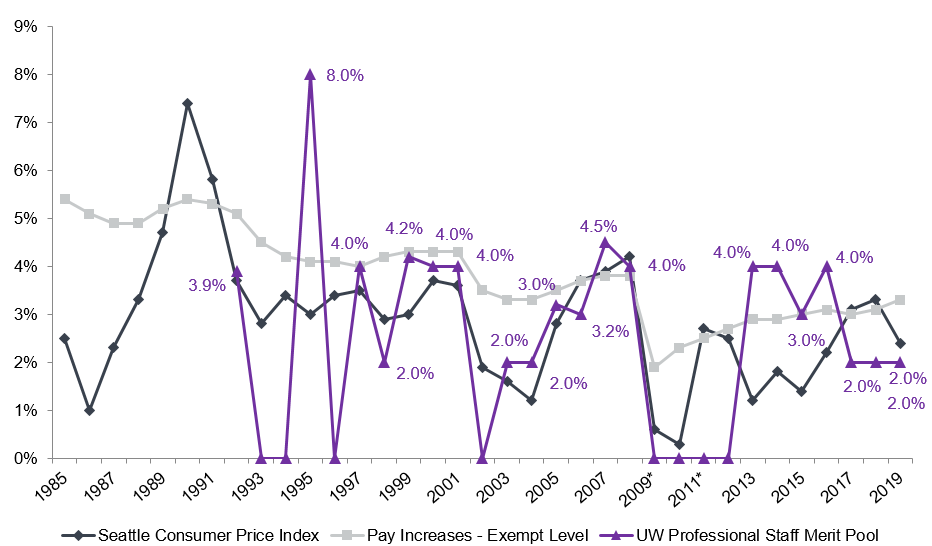
* State-imposed salary freeze February 2009 through 2012.
Note: 2019 Data includes the University’s Estimate for 2019 as well as partial year Consumer Price Index.
The 56 benchmark jobs, chosen by the UW Compensation Office, the Professional Staff Salary Survey Advisory Committee, and Milliman provide a solid representation of jobs and employees within the University’s grade structure and across job groups as summarized below:
Professional Staff Survey 2019
Breakdown of Population by Grades 5 to 11

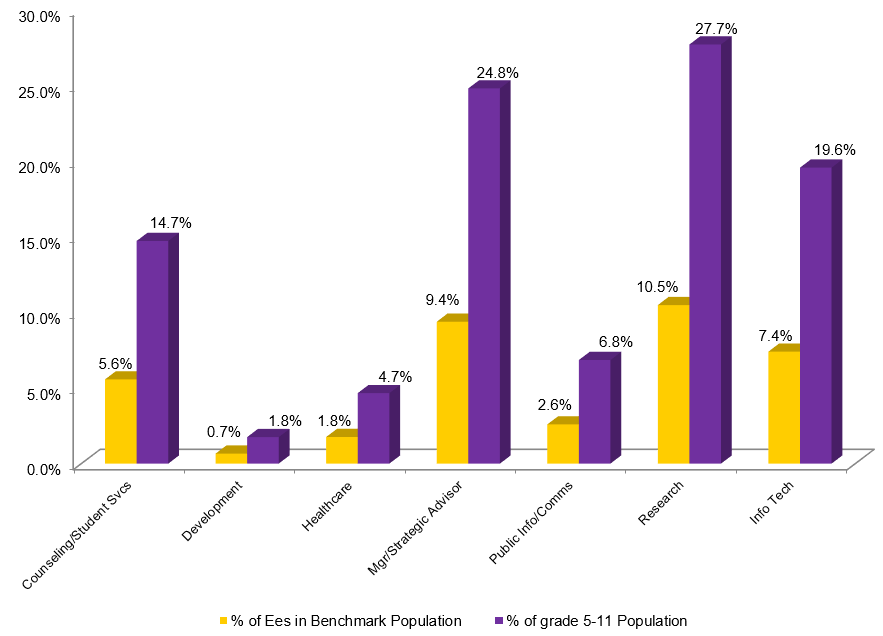
Professional Staff Survey 2019
Breakdown of Population by Benchmark Categories
(9,654 Ees in Grades 5-11; 3,651 Ees in Benchmark Jobs)
The University’s entire professional staff supports one of the nation’s premier public research universities. UW Medicine is a leading health care provider in the region and nationally known for a number of its programs. The staff in this group on all three of the University’s campuses provide expertise to support the University’s teaching, research and public service mission.
Maintaining competitive levels of compensation is critical to staff retention. Compensation for new hires is also critical in that the University must offer competitive rates consistent with what their peers are offering as well as what existing employees at the University are being paid.
This analysis covers professional staff jobs in grades 5 through 11, which includes 9,654 employees.
The University sources professional staff employees from the education sector and from general industry (including the private sector). In instances of turnover, the University loses employees to both of these markets. The private sector can often provide a total pay package that includes elements that the University does not offer and which make competing difficult for most educational institutions. For example, the private sector is able to offer direct compensation that consists of base salary, annual incentives, benefits and often long-term incentives such as stock options.
The University is limited in the value of its total compensation package by the absence of annual and/or long-term incentives. Historically the University has addressed this limitation by:
- Targeting total cash compensation (base plus incentives) for these jobs at the 50th percentile total cash level in the market. This practice provides the University with the ability to offer a stronger cash compensation package than many of its counterparts.
- Providing benefits that are above average in the market. Medical, dental, disability and retirement benefits have traditionally been, and continue to be, above the median and close to or above the 75th percentile when compared to Milliman’s database.
Additionally, when making a national hire the University is more challenged than many of its peer institutions because of its location. The cost of living in the greater Seattle area is roughly 52% higher than the national average, according to Economic Research Institute data. Cost of living certainly impacts the decisions of potential employees from other parts of the country. While the cost of labor in Seattle is 13% higher than the national average and new recruits can make more dollars here than in many locations, the difference can present obstacles to recruiting.
While the above elements can impact recruitment, the University provides a number of significant attractions beyond direct compensation. These include a highly desirable location, the opportunity to work at a premier institution of higher education, a stimulating work environment, job security, and rich cultural experiences, to name just a few.
This compensation analysis included a custom survey of institutions of higher education and data from published surveys. Published data used are primarily regional in nature while the custom survey included universities across the United States (global challenge peer institutions as well as the University’s primary peer group). All national data in this report, both published survey data and data from the custom survey, have been geographically adjusted to reflect the Puget Sound area.
Methods
Benchmark positions and compensation data sources
Cash compensation in general is well aligned with the market TCC 50th percentile. When comparing the University of Washington individual salaries to the market TCC 50th percentile, the University employee-weighted average is 8.6% below the market. When the Research job grouping is excluded, which has historically been an outlier, the employee weighted average is closer to the market with a market lag of only 3.6%.
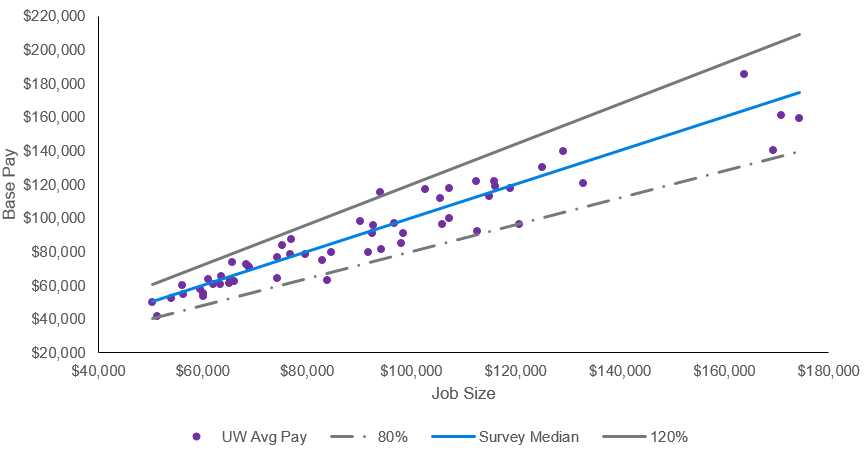
Similar to the previous professional staff studies, the results suggest that the University has been able to provide reasonably competitive compensation around the market target. The chart below shows how the University’s base pay compares to a normal range around the market TCC 50th percentile (a normal range is usually considered between 80% and 120% of the market competitive level). As illustrated, nearly all jobs fall within a “normal” range around the market 50th percentile.
Normal Market Range
Benchmark positions and compensation data sources
| Job Family | Benchmark | Survey Data Source Note: Hover over dot to view source |
|||||||||||||
|---|---|---|---|---|---|---|---|---|---|---|---|---|---|---|---|
| Counseling / Student Services | |||||||||||||||
| C | Academic Counselor |
x
|
x
|
x
|
|||||||||||
| C | Academic Counselor – Lead |
x
|
|||||||||||||
| C | Counseling Services Coordinator |
x
|
x
|
||||||||||||
| C | Education Outreach – Program Manager |
x
|
x
|
||||||||||||
| C | Education Outreach Specialist (Entry) |
x
|
|||||||||||||
| C | Mental Health Therapist |
x
|
x
|
x
|
|||||||||||
| C | Student or Academic Services Director |
x
|
|||||||||||||
| C | Student Services Advisor/Counselor |
x
|
x
|
x
|
|||||||||||
| C | Student Services Advisor/Counselor (Lead) |
x
|
|||||||||||||
| C | Student Services Advisor/Counselor (Senior) |
x
|
x
|
||||||||||||
| Development | |||||||||||||||
| D | Development Officer |
x
|
|||||||||||||
| D | Major Gifts Officer |
x
|
x
|
x
|
x
|
||||||||||
| Health Care | |||||||||||||||
| H | Clinical Nurse Specialist Educator |
x
|
x
|
||||||||||||
| H | Clinic Manager |
x
|
|||||||||||||
| H | Diagnostic Imaging Administrative Director |
x
|
x
|
x
|
|||||||||||
| H | Financial Analyst/Decision Support |
x
|
x
|
x
|
|||||||||||
| H | Nurse Manager |
x
|
x
|
x
|
x
|
||||||||||
| H | Pharmacy Manager |
x
|
x
|
||||||||||||
| Manager/Strategic Advisor | |||||||||||||||
| M | Administrative Assistant |
x
|
x
|
||||||||||||
| M | Administrator (Large Organization) |
x
|
|||||||||||||
| M | Administrator (Small Organization) |
x
|
|||||||||||||
| M | Auditor |
x
|
x
|
x
|
|||||||||||
| M | Budget Analyst |
x
|
x
|
x
|
x
|
||||||||||
| M | Compliance Analyst |
x
|
|||||||||||||
| M | Construction Project Manager |
x
|
x
|
x
|
|||||||||||
| M | Executive Assistant |
x
|
x
|
x
|
|||||||||||
| M | Food Service Assistant Manager |
x
|
x
|
||||||||||||
| M | Food Service Manager |
x
|
x
|
||||||||||||
| M | Grants and Contracts Program Manager/Specialist |
x
|
x
|
||||||||||||
| M | Human Resources Consultant – Employee Relations |
x
|
x
|
x
|
|||||||||||
| M | Program Director/Manager (Large Program) |
x
|
|||||||||||||
| M | Program Director/Manager (Small Program) |
x
|
|||||||||||||
| Public Information/Communications | |||||||||||||||
| P | Graphic Designer |
x
|
x
|
x
|
x
|
||||||||||
| P | Public Information Specialist (Entry Level) |
x
|
|||||||||||||
| P | Public Information Specialist (Journey Level) |
x
|
x
|
x
|
|||||||||||
| P | Public Information Specialist (Senior Level) |
x
|
x
|
x
|
|||||||||||
| P | Publications Coordinator |
x
|
|||||||||||||
| P | Web Content Specialist |
x
|
x
|
x
|
|||||||||||
| Research | |||||||||||||||
| R | Assistant Research Scientist/Research Engineer |
x
|
|||||||||||||
| R | Associate Research Scientist/Research Engineer |
x
|
x
|
x
|
|||||||||||
| R | Principal Research Scientist/Research Engineer |
x
|
x
|
x
|
|||||||||||
| R | Research Consultant |
x
|
|||||||||||||
| R | Research Coordinator |
x
|
|||||||||||||
| R | Research Scientist/Research Engineer |
x
|
x
|
x
|
|||||||||||
| Information Technology | |||||||||||||||
| T | Business System Analyst |
x
|
x
|
x
|
|||||||||||
| T | Department IT Manager |
x
|
x
|
||||||||||||
| T | Director, IT (Large Organization) |
x
|
x
|
x
|
|||||||||||
| T | Network Engineer |
x
|
x
|
x
|
x
|
||||||||||
| T | Principal Technology Program Manager – Enterprise-Wide Systems |
x
|
x
|
||||||||||||
| T | Senior Applications Systems Engineer – Enterprise-Wide Systems |
x
|
x
|
x
|
|||||||||||
| T | Senior Computer Specialist |
x
|
x
|
x
|
x
|
x
|
|||||||||
| T | Software Engineer |
x
|
x
|
x
|
|||||||||||
| T | Systems Programmer |
x
|
x
|
x
|
x
|
x
|
|||||||||
| T | Technology Program Manager – Enterprise-Wide Systems |
x
|
|||||||||||||
| T | Technology Project Manager |
x
|
x
|
x
|
|||||||||||
| T | Web Computing Specialist |
x
|
x
|
x
|
x
|
x
|
|||||||||
Custom survey invitees included peer universities and a group of regional higher education institutions (77 total). The following tables show organizations contacted and those submitting data for the 2012, 2015, 2017 and 2019 survey. Each year of the custom survey approximately 1/3 of the invited institutions participate.
| Peer Institutions | 2012 Participant | 2015 Participant | 2017 Participant | 2019 Participant |
|---|---|---|---|---|
| Baylor University | ||||
| Boise State University |
2019
|
|||
| Colorado State |
2012
|
|||
| Cornell University |
2012
|
2015
|
2017
|
2019
|
| Duke University | ||||
| Florida State University | ||||
| Georgetown University |
2019
|
|||
| Georgia Institute of Technology |
2012
|
2015
|
2017
|
|
| Indiana University |
2012
|
2015
|
||
| Iowa State University |
2015
|
2017
|
2019
|
|
| Johns Hopkins University |
2012
|
|||
| Michigan State University |
2015
|
|||
| Montana State University | ||||
| New York University |
2012
|
|||
| North Carolina State University | ||||
| Ohio State University |
2015
|
2017
|
2019
|
|
| Oregon Health Sciences University |
2012
|
2017
|
2019
|
|
| Penn State | ||||
| Rutgers University |
2017
|
2019
|
||
| Seattle University |
2015
|
2019
|
||
| Stanford University | ||||
| Syracuse University |
2017
|
2019
|
||
| Temple University |
2012
|
2015
|
||
| Texas A&M University |
2017
|
2019
|
||
| University of Alabama | ||||
| University of Arizona | ||||
| University of California – Berkeley | ||||
| University of California – Davis |
2012
|
|||
| University of California – Irvine |
2012
|
2015
|
2017
|
|
| University of California – Los Angeles | ||||
| University of California – San Diego |
2012
|
|||
| University of California – San Francisco | ||||
| University of Chicago | ||||
| University of Cincinnati |
2012
|
|||
| University of Colorado |
2019
|
|||
| University of Connecticut | ||||
| University of Dayton |
2015
|
2017
|
||
| University of Florida | ||||
| University of Georgia |
2015
|
|||
| University of Hawaii at Manoa |
2012
|
2017
|
||
| University of Illinois – Chicago | ||||
| University of Iowa |
2012
|
2015
|
2017
|
2019
|
| University of Kansas |
2015
|
2017
|
2019
|
|
| University of Kentucky |
2015
|
2017
|
||
| University of Maryland | ||||
| University of Massachusetts | ||||
| University of Michigan – Ann Arbor |
2012
|
2019
|
||
| University of Minnesota Twin Cities |
2017
|
2019
|
||
| University of Missouri – Columbia |
2012
|
|||
| University of Montana |
2012
|
2015
|
2017
|
|
| University of New Mexico – Albuquerque |
2015
|
2017
|
2019
|
|
| University of North Carolina – Chapel Hill |
2012
|
|||
| University of Notre Dame |
2017
|
|||
| University of Oregon | ||||
| University of Pennsylvania |
2015
|
2017
|
2019
|
|
| University of Pittsburgh |
2015
|
2019
|
||
| University of Rochester |
2015
|
|||
| University of Texas – Austin |
2012
|
2015
|
2017
|
2019
|
| University of Utah |
2012
|
2017
|
||
| University of Virginia |
2012
|
2015
|
||
| University of Wisconsin at Madison | ||||
| Virginia Polytechnic Institute |
2015
|
2017
|
2019
|
|
| Washington State University |
2012
|
2015
|
2019
|
|
| West Virginia University |
2012
|
2017
|
||
| Western Washington University |
2012
|
2015
|
2019
|
|
| Yale University |
2015
|
2017
|
Published survey sources included both regional and national surveys. The list of surveys used in these analyses follows:
| National Surveys | Regional Surveys |
|---|---|
| UW Higher Education Custom Survey | Milliman Northwest Benefits Survey |
| CUPA HR Professionals in Higher Education Survey | Milliman Northwest Health Care |
| Economic Research Institute – Salary Assessor | Milliman Northwest Engineering / Scientific / Project Management Survey |
| Hospital/Physicians Salary & Benefits Report | Milliman Northwest Management & Professional Compensation Survey |
| Payfactors compensation database | Milliman Northwest Technology Survey |
| Pearl Meyer Research & Development | Milliman Puget Sound Area Compensation Survey |
| Sullivan Cotter Manager & Executive Compensation in Hospitals Salary Survey | |
| Wamser University Foundation / Development Office Compensation Survey |
Data reporting and analyses
Data gathered from all surveys were aged to May 1, 2019.
Job descriptions were provided to custom survey participants to assist them with job matching. Milliman followed up with each participant to clarify job matches and input where necessary.
Milliman consultants began with the University reviewed job matches from 2017 and verified that they continued to be a good match in 2019.
Data provided in this report for all survey matches, where such data were available, (additional detailed data on market percentiles are included in the appendix) include base salary 50th and total cash compensation 50th.
Milliman compared the University’s benchmark average data to the market median total cash compensation (50th percentile). Other comparisons can be made using this data, but Milliman believes the 50th percentile is the strongest point of comparison because:
- The 50th percentile is statistically more stable
- Outliers have less impact on this data point
- Participant changes have less impact on this data point
- Without a variable pay plan, the University should take into account the other cash compensation available in the market by targeting market total cash
Using median total cash compensation (50th percentile) presents somewhat of a problem for the University. Some of the key surveys relied on for this study, such as CUPA, do not report total cash data. In light of this, for the purposes of this study, the University requested Milliman make the working assumption for survey sources not reporting median total cash that median base be equal to median total cash.
Explanation of data terms and tables
Job Family
The group to which the benchmark is connected for purposes of evaluating competitive pay w ithin a group of benchmarks
UW Job Code
The unique number assigned to a job at the University
UW Job Title
Current University of Washington job title which may be different from the survey title
# UW Employees
Current count of employees assigned to the job title/code
UW Average Annual Pay
The average annualized base salary of incumbents in the job as of May 2019
Market 50th Base
Median (50th percentile) of actual pay for the job in the market data sources
Market 50th TCC
Actual total cash compensation paid f or the job in the market data sources
UW/Market 50th TCC
The ratio of average pay for the job at the University of Washington compared to the market target
UW Salary Grade
Current pay grade assigned to the jobs
Survey Code
The job code assigned to each benchmark job
Survey Job Title
The title of the similar job in the survey source (note: jobs w ere matched not based on title but on job responsibilities, etc.)
Scope
The size or nature of the organizations included in the data from each survey source
Base 25th
The market salary level at which 25% of organizations pay below
Base 50th
The market salary level where half of organizations pay above and half below
Base Average
The weighted average of pay for the job in the market
Base 75th
The market salary level w here 25% of organizations pay above
TCC
Total cash compensation (listed at the same market levels as above)
Market Target
The University of Washington’s identified competitive level of pay for the job (market 50th total cash compensation)
Survey findings
Summary of competitive analyses
The following pages summarize the competitive position of each benchmark against the market 50th percentile total cash compensation. The last column indicates the ratio of the University’s average pay to the market 50th total cash compensation.
| Job Family | UW Job Code | Counseling/Student Services | # UW EES | UW/Mkt 50th TCC |
|---|---|---|---|---|
| C | 11347 | Academic Counselor | 39 | -3.1% |
| C | 11349, 11350 | Academic Counselor – Lead | 27 | 2.8% |
| C | 11377, 19617 | Counseling Services Coordinator | 185 | -4.9% |
| C | 11209 | Education Outreach – Program Manager | 57 | 9.8% |
| C | 11207, 11967, 19837 | Education Outreach Specialist (Entry) | 78 | 3.4% |
| C | 11308 | Mental Health Therapist | 15 | 3.5% |
| C | 11361 | Student or Academic Services Director | 53 | -15.8% |
| C | 11341, 19596 | Student Services Advisor/Counselor | 30 | -3.8% |
| C | 11343 | Student Services Advisor/Counselor (Lead) | 19 | 2.1% |
| C | 11342, 19597 | Student Services Advisor/Counselor (Senior) | 34 | -3.1% |
| Total Incumbents & Weighted Average: | 537 | -2.0% | ||
| Job Family | UW Job Code | Development | # UW Ees | UW/Mkt 50th TCC |
| D | 11629 | Development Officer | 11 | -16.3% |
| D | 11554 | Major Gifts Officer | 53 | -10.4% |
| Total Incumbents & Weighted Average: | 64 | -11.4% | ||
| Job Family | UW Job Code | Health Care | # UW Ees | UW/Mkt 50th TCC |
| H | 11200 | Clinical Nurse Specialist Educator | 44 | 8.5% |
| H | 11590 | Clinic Manager | 50 | 4.7% |
| H | 11111 | Diagnostic Imaging Administrative Director | 2 | 11.6% |
| H | 11184 | Financial Analyst/Decision Support | 11 | -1.5% |
| H | 11580 | Nurse Manager | 51 | 4.0% |
| H | 11590 | Pharmacy Manager | 12 | -6.1% |
| Total Incumbents & Weighted Average: | 170 | 4.4% | ||
| Job Family | UW Job Code | Manager/Strategic Advisor | # UW Ees | UW/Mkt 50th TCC |
| M | 19806, 11176, 11926, 19514, 11315, 19552, 19556, 11386, 19586, 19626, 11336 | Administrative Assistant | 21 | 6.4% |
| M | 11250, 11300, 11500 | Administrator (Large Organization) | 80 | -2.1% |
| M | 11248, 11298, 11503 | Administrator (Small Organization) | 72 | -6.7% |
| M | 11556 | Auditor | 11 | 11.9% |
| M | 11532 | Budget Analyst | 6 | 0.0% |
| M | 11799 | Compliance Analyst | 53 | 1.6% |
| M | 11070 | Construction Project Manager | 13 | 7.5% |
| M | 11157, 11257, 11314, 11337, 11387, 11944, 19557, 19587, 19553, 11177, 19517, 19807, 19817, 11927, 19513, 19627 | Executive Assistant | 213 | -15.8% |
| M | 11506 | Food Service Assistant Manager | 11 | -12.5% |
| M | 11508 | Food Service Manager | 24 | 5.7% |
| M | 11775 | Grants and Contracts Program Manager/Specialist | 31 | 2.7% |
| M | 11089 | Human Resources Consultant – Employee Relations | 23 | -8.4% |
| M | 11110, 11130, 11150, 11510 | Program Director/Manager (Large Program) | 206 | 5.5% |
| M | 11108, 11128, 11148, 11508, 11528 | Program Director/Manager (Small Program) | 141 | -1.5% |
| Total Incumbents & Weighted Average: | 905 | -3.1% | ||
| Job Family | UW Job Code | Public Information/Communications | # UW Ees | UW/Mkt 50th TCC |
| P | 11697 | Graphic Designer | 32 | -5.8% |
| P | 19735 | Public Information Specialist (Entry Level) | 4 | -0.8% |
| P | 11537, 19737 | Public Information Specialist (Journey Level) | 80 | -6.8% |
| P | 11538, 19738 | Public Information Specialist (Senior Level) | 91 | -10.9% |
| P | 11672, 19777 | Publications Coordinator | 17 | -2.1% |
| P | 11687, 19687 | Web Content Specialist | 26 | -4.2% |
| Total Incumbents & Weighted Average: | 250 | -7.5% | ||
| Job Family | UW Job Code | Research | # UW Ees | UW/Mkt 50th TCC |
| R | 19691 | Assistant Research Scientist/Research Engineer | 72 | -23.3% |
| R | 19693, 11493 | Associate Research Scientist/Research Engineer | 382 | -34.0% |
| R | 11497 | Principal Research Scientist/Research Engineer | 84 | -20.7% |
| R | 19696 | Research Consultant | 10 | -8.8% |
| R | 11758 | Research Coordinator | 147 | 11.0% |
| R | 1495 | Research Scientist/Research Engineer | 316 | -22.0% |
| Total Incumbents & Weighted Average: | 1,001 | -21.6% | ||
| Job Family | UW Job Code | Information Technology | # UW Ees | UW/Mkt 50th TCC |
| T | 11681 | Business System Analyst | 44 | 7.7% |
| T | 11735 | Department IT Manager | 34 | -10.1% |
| T | 11745 | Director, IT (Large Organization) | 18 | -9.6% |
| T | 11564 | Network Engineer | 25 | 18.2% |
| T | 11741 | Principal Technology Program Manager – Enterprise-Wide Systems | 17 | 7.6% |
| T | 11730 | Senior Applications Systems Engineer – Enterprise-Wide Systems | 62 | -1.1% |
| T | 11568 | Senior Computer Specialist | 325 | -15.8% |
| T | 11490, 11560 | Software Engineer | 85 | 12.2% |
| T | 11572 | Systems Programmer | 15 | -7.4% |
| T | 11739 | Technology Program Manager – Enterprise-Wide Systems | 4 | -25.7% |
| T | 11680 | Technology Project Manager | 48 | 2.3% |
| T | 11743 | Web Computing Specialist | 37 | 2.9% |
| Total Incumbents & Weighted Average: | 714 | -5.3% | ||
Note: TCC or total cash compensation is defined as base salary plus annual incentives/bonuses, such as short-term incentives. For jobs where there is little or no incentive opportunity, median total cash is effectively the same as the market 50th (median) base. Most jobs in higher education in fact have no bonus or incentive pay and therefore, for these jobs, base salary equals total cash, since the value of bonuses and annual incentives for these jobs is zero.
The University is generally competitive with the market, lagging by approximately 8.6% overall (weighted average) however, the level of competitiveness varies by job grouping and grade.
The following table shows how each job grouping has compared to the market UW Average Annual Pay versus TCC 50th over the last four studies.
The Research job group has been consistently lagging the market by 15% or more since 2012.
Health Care pay at the University has consistently lead compared to the market during the last four studies.
| Job Groupings (difference by percentage) | 2012 | 2015 | 2017 | 2019 |
|---|---|---|---|---|
| Counseling/Student Services | -3.4 | -5.0 | -5.6 | -2.0 |
| Development | -8.8 | -15.6 | -13.5 | -11.4 |
| Health Care | 5.7 | 11.3 | 10.9 | 4.4 |
| Manager/Strategic Advisor | -1.2 | -0.9 | 1.4 | -3.0 |
| Public Information/Communications | -12.9 | -10.8 | -5.0 | -7.5 |
| Research | -15.7 | -17.1 | -17.2 | -21.6 |
| Information Technology | -7.3 | -5.3 | -4.4 | -5.3 |
Competitive analysis by salary grade
The following tables provide comparison by grades for the benchmark positions.
| Job Family | UW Job Code | Job Title | UW Salary Grade | # UW Ees | UW/Mkt 50th TCC |
|---|---|---|---|---|---|
| H | 11111 | Diagnostic Imaging Administrative Director | 11 | 2 | 11.6% |
| T | 11745 | Director, IT (Large Organization) | 11 | 18 | -9.6% |
| R | 11497 | Principal Research Scientist/Research Engineer | 11 | 84 | -20.7% |
| T | 11741 | Principal Technology Program Manager – Enterprise-Wide Systems | 11 | 17 | 7.6% |
| Total Incumbents & Weighted Average: | 121 | -14.6% | |||
| M | 11250, 11300, 11500 | Administrator (Large Organization) | 10 | 80 | -2.1% |
| H | 11590 | Clinic Manager | 10 | 50 | 4.7% |
| H | 11200 | Clinical Nurse Specialist Educator | 10 | 44 | 8.5% |
| M | 11070 | Construction Project Manager | 10 | 13 | 7.5% |
| T | 11735 | Department IT Manager | 10 | 34 | -10.1% |
| D | 11554 | Major Gifts Officer | 10 | 53 | -10.4% |
| T | 11564 | Network Engineer | 10 | 25 | 18.2% |
| H | 11580 | Nurse Manager | 10 | 51 | 4.0% |
| H | 11590 | Pharmacy Manager | 10 | 12 | -6.1% |
| M | 11110, 11130, 11150, 11510 | Program Director/Manager (Large Program) | 10 | 206 | 5.5% |
| T | 11730 | Senior Applications Systems Engineer – Enterprise-Wide Systems | 10 | 62 | -1.1% |
| T | 11490, 11560 | Software Engineer | 10 | 85 | 12.2% |
| T | 11680 | Technology Project Manager | 10 | 48 | 2.3% |
| Total Incumbents & Weighted Average: | 763 | 3.2% | |||
| M | 11532 | Budget Analyst | 9 | 6 | 0.0% |
| T | 11681 | Business System Analyst | 9 | 44 | 7.7% |
| M | 11799 | Compliance Analyst | 9 | 53 | 1.6% |
| D | 11629 | Development Officer | 9 | 11 | -16.3% |
| C | 11209 | Education Outreach – Program Manager | 9 | 57 | 9.8% |
| H | 11184 | Financial Analyst/Decision Support | 9 | 11 | -1.5% |
| M | 11089 | Human Resources Consultant – Employee Relations | 9 | 23 | -8.4% |
| R | 11495 | Research Scientist/Research Engineer | 9 | 316 | -22.0% |
| C | 11361 | Student or Academic Services Director | 9 | 53 | -15.8% |
| T | 11572 | Systems Programmer | 9 | 15 | -7.4% |
| T | 11739 | Technology Program Manager – Enterprise-Wide Systems | 9 | 4 | -25.7% |
| T | 11743 | Web Computing Specialist | 9 | 37 | 2.9% |
| Total Incumbents & Weighted Average: | 630 | -11.6% | |||
| C | 11349, 11350 | Academic Counselor – Lead | 8 | 27 | 2.8% |
| M | 11248, 11298, 11503 | Administrator (Small Organization) | 8 | 72 | -6.7% |
| M | 11556 | Auditor | 8 | 11 | 11.9% |
| M | 11508 | Food Service Manager | 8 | 24 | 5.7% |
| M | 11775 | Grants and Contracts Program Manager/Specialist | 8 | 31 | 2.7% |
| H | 11308 | Mental Health Therapist | 8 | 15 | 3.5% |
| M | 11108, 11128, 11148, 11508, 11528 | Program Director/Manager (Small Program) | 8 | 141 | -1.5% |
| P | 11538, 19738 | Public Information Specialist (Senior Level) | 8 | 91 | -10.9% |
| R | 11758 | Research Coordinator | 8 | 147 | 11.0% |
| T | 11568 | Senior Computer Specialist | 8 | 325 | -15.8% |
| C | 11343 | Student Services Advisor/Counselor (Lead) | 8 | 19 | 2.1% |
| Total Incumbents & Weighted Average: | 903 | -5.2% | |||
| R | 19693, 11493 | Associate Research Scientist/Research Engineer | 7 | 382 | -34.0% |
| C | 11377, 19617 | Counseling Services Coordinator | 7 | 185 | -4.9% |
| C | 11207, 11967, 19837 | Education Outreach Specialist (Entry) | 7 | 78 | 3.4% |
| M | 11157, 11257, 11314, 11337, 11387, 11944, 19557, 19587, 19553, 11177, 19517, 19807, 19817, 11927, 19513, 19627 | Executive Assistant | 7 | 213 | -15.8% |
| P | 11697 | Graphic Designer | 7 | 32 | -5.8% |
| P | 11537, 19737 | Public Information Specialist (Journey Level) | 7 | 80 | -6.8% |
| P | 11672, 19777 | Publications Coordinator | 7 | 17 | -2.1% |
| C | 11342, 19597 | Student Services Advisor/Counselor (Senior) | 7 | 34 | -3.1% |
| P | 11687, 19687 | Web Content Specialist | 7 | 26 | -4.2% |
| Total Incumbents & Weighted Average: | 1,047 | -17.2% | |||
| C | 11347 | Academic Counselor | 6 | 39 | -3.1% |
| M | 19806, 11176, 11926, 19514, 11315, 19552, 19556, 11386, 19586, 19626, 11336 | Administrative Assistant | 6 | 21 | 6.4% |
| M | 11506 | Food Service Assistant Manager | 6 | 11 | -12.5% |
| R | 19696 | Research Consultant | 6 | 10 | -8.8% |
| C | 11341, 19596 | Student Services Advisor/Counselor | 6 | 30 | -3.8% |
| Total Incumbents & Weighted Average: | 111 | -2.9% | |||
| R | 19691 | Assistant Research Scientist/Research Engineer | 5 | 72 | -23.3% |
| P | 19735 | Public Information Specialist (Entry Level) | 5 | 4 | -0.8% |
| Total Incumbents & Weighted Average: | 76 | -22.1% | |||
The following table shows how each grade has compared to the market (UW Average Annual Pay versus TCC 50th) over the last four studies.
The most significant and consistent market lag has been with Grade 7.
| UW Avg Pay vs TCC 50th (percentage difference by Job Grade) | 2012 | 2015 | 2017 | 2019 |
|---|---|---|---|---|
| 11 | -7.5 | -9.9 | -4.1 | -14.6 |
| 10 | 2.9 | 5.1 | 9.3 | 3.2 |
| 9 | -12.5 | -9.7 | -8.8 | -11.5 |
| 8 | -4.0 | -4.6 | -4.1 | -5.2 |
| 7 | -14.3 | -16.3 | -17.3 | -17.2 |
| 6 | -7.6 | -15.4 | -12.1 | -2.9 |
| 5 | -30.3 | -13.9 | -19.5 | -22.1 |
UW benchmark job descriptions
- Academic Counselor
- Academic Counselor – Lead
- Counseling Services Coordinator
- Education Outreach – Program Manager
- Education Outreach Specialist (Entry)
- Mental Health Therapist – Student Health Care Center
- Student or Academic Services Director
- Student Services Advisor/Counselor
- Student Services Advisor/Counselor (Lead)
- Student Services Advisor/Counselor (Senior)
- Development Officer
- Major Gifts Officer
- Clinical Nurse Specialist/Educator
- Clinic Manager
- Diagnostic Imaging Administrative Director
- Financial Analyst/Decision Support
- Nurse Manager
- Pharmacy Manager
- Administrative Assistant
- Administrator (Large Organization)
- Administrator (Small Organization)
- Auditor
- Budget Analyst
- Compliance Analyst
- Construction Project Manager
- Executive Assistant
- Food Service Assistant Manager
- Food Service Manager
- Grants And Contracts Program Manager/Specialist
- Human Resources Consultant – Employee Relations
- Program Director/Manager (Large Program)
- Program Director/Manager (Small Program)
- Graphic Designer
- Public Information Specialist (Entry Level)
- Public Information Specialist (Journey Level)
- Public Information Specialist (Senior Level)
- Publications Coordinator
- Web Content Specialist
- Assistant Research Scientist/Research Engineer
- Associate Research Scientist/Research Engineer
- Principal Research Scientist/Research Engineer
- Research Consultant
- Research Coordinator
- Research Scientist/Research Engineer
- Business System Analyst
- Department IT Manager
- Director, IT (Large Organization)
- Network Engineer
- Principal Technology Program Manager – Enterprise-Wide Systems – Business Applications
- Senior Applications System Engineer – Enterprise-Wide Systems
- Senior Computer Specialist
- Software Engineer
- Systems Programmer
- Technology Program Manager – Enterprise-Wide Systems – Business Applications
- Technology Project Manager
- Web Computing Specialist